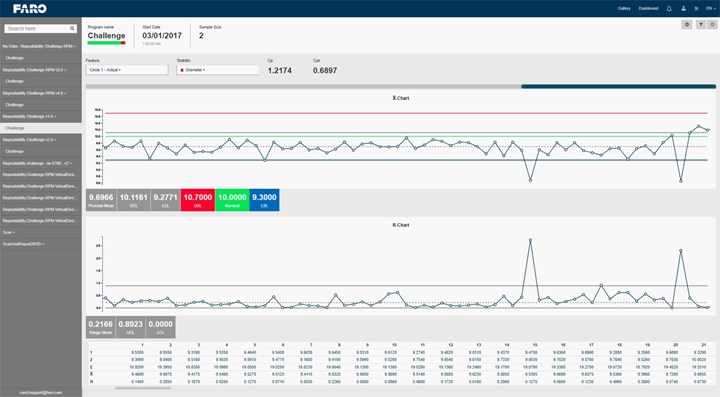
A sample statistical process control (SPC)/statistical quality control (SQC) output from a CMM. Photo Credit: Faro
If there is one call a mold builder or mold base supplier does not want to receive, it is a customer complaint about an out-of-tolerance mold or mold base because making corrections at this point in the process is nearly impossible. Once the mold builder identifies the cause of the out-of-tolerance condition (something as simple as an out-of-tolerance machine axis, for example), he hopes that it has not impacted other finished products, as the cost of replacing or re-machining is time-consuming and expensive.
Let’s face it, machining mold bases and molds for plastic injection molding is an art form requiring tighter tolerances than traditional machine shops on top of competitive pricing with rapid delivery. For example, mold builders must hold ± 0.002 or tighter while general machine shops have ± 0.005. Unfortunately, maintaining these tight tolerances consistently is an ongoing challenge and too often smaller mold builders rely on the accuracy of the machining center to maintain tolerances, conduct inspection measurements using a dial indicator on a stand they drag across a granite plate to check parallelism and/or use a handheld micrometer to check thickness.
Featured Content
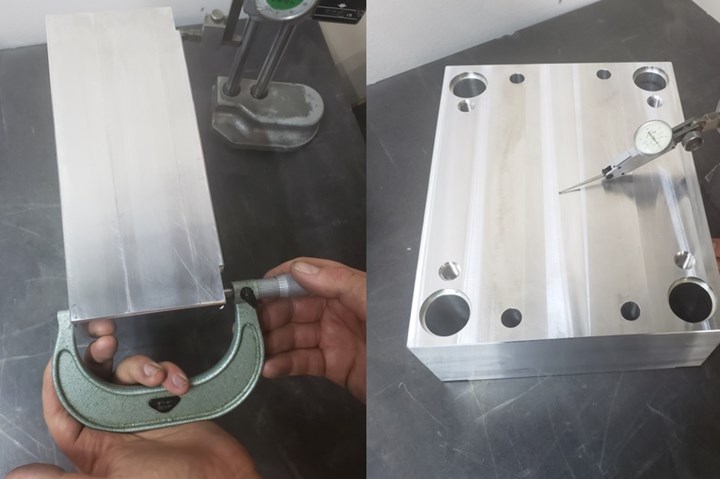
Checking part thickness with a handheld micrometer (left) and checking parallelism with dial indicator via a granite block surface (right). Photo Credit: American Quality Molds
Solving the Out-of-Tolerance Problem
An independent inspection measuring system tied to statistical process control (SPC)/statistical quality control (SQC) software is a better solution. This system will not prevent a machining center from going out of tolerance, but it is the best chance of catching the machine drift before it goes out of tolerance, so you do not ship out-of-tolerance parts to a customer.
Overall, SPC/SQC seeks to achieve process stability while improving capability through the reduction in variability. It achieves this by monitoring how a process changes over time to detect trends leading to out-of-control situations.
The internet is replete with instructional videos on SPC/SQC and provides Excel-based software that one can import and configure for one’s use. There are also commercial SPC/SQC software packages that may be more suitable and easier to use. It is vital that the software produces a control chart, known as an “R-Chart,” for each machine feature considered essential, especially repetitive operations.
Note that an R-Chart is a statistical variance over time. Therefore, for each R-Chart, the shop will need to specify upper and lower control limits. This must consider any natural or normal random variation around a desired or normal mean value/measurement. The control limits should be set so they are reached before the part goes out of tolerance.
One note of caution concerning SPC/SQC systems: Be sure that what you are measuring is statistically significant, as these systems can collect all kinds of irrelevant data that seem statistically significant when it is not. Design your SPC/SQC system to collect only relevant data to keep your shop operating at peak efficiency within the bounds of assuring the quality of those parts being “shipped out the door.”
RELATED CONTENT
-
IMTS Showcases Software, Additive Manufacturing, Inspection and Measurement Tools for Moldmakers
MoldMaking Technology previews a selection of the software, additive manufacturing, inspection and measurement tools that will be present at IMTS.
-
Using CT Scanning to Qualify Molds Faster
Software and hardware advances reduce dimensional inspection with part-to-CAD by 70%.
-
Intuitive, Easy-to-Use Inspection Software for Portable Probing and Scanning Simplifies Mold Measurement
Enhanced inspection software and hardware with portable measurement, analysis and reporting improves productivity.


